> ## Documentation Index
> Fetch the complete documentation index at: https://docs.attention.com/llms.txt
> Use this file to discover all available pages before exploring further.
# Track Scorecard Results Over Time
> Follow how your team scores on a scorecard, compare people and teams, and drill down into a rep's calls.
**Scoring** shows how calls score on a scorecard over time, for your whole organization, a team or a single rep. Managers and admins find it under **Analytics** in the sidebar. Scores come from your scorecard templates; to build one, see [Build a Scorecard Template](/workspace-setup/create-scorecards). To read the results of a single call, see [Review Scorecards on a Call](/core-features/scorecards-on-a-call).
## 1. Open Scoring
In the sidebar, go to **Analytics → Scoring**.
The page opens on **Scorecard Summary**, with a chart at the top and the **All Team Members** table below it.
## 2. Pick a scorecard and a date range
At the top of the page, next to **Scorecard Summary**:
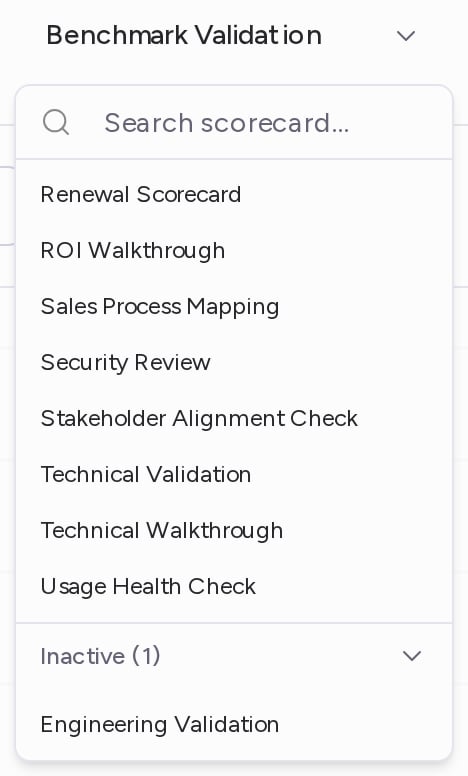
1. Click the scorecard picker and choose a scorecard. You can type in **Search scorecard...** to find it. The page opens on your first active scorecard.
2. Click the date range and choose **Past Week**, **Past Month**, **Past Year** or **Max**. To pick your own dates, click **Custom Date Range**. The page opens on **Past Week**.
The chart and the table both update to the scorecard and dates you pick.
Scorecards that were turned off keep their results. They are listed under **Inactive** at the bottom of the picker: click **Inactive** to expand the list. When you pick one, it shows an **Inactive** badge and the page shows its historical data.
 ## 3. Read the chart
By default, the chart shows **All Teams Average**: the overall score of every scored call in the date range, as a trend line.
To change what the chart shows, use the controls above it:
* **Scorecard Average**: the first dropdown charts the overall score. Pick one of the scorecard's fields instead to chart that criterion alone.
* **People**: pick teams or reps to compare. Each one gets its own line, and each team also has an average option named after it (for example, **Sales Average**). Use **Search...** to find someone, or **Select All**. Click **Reset** to go back to the overall view. If you manage a team, the chart opens with your primary team and its members already picked.
* **Show Calls**: shows each scored call as a dot on the chart. Hover over a dot to see the call's title and score, and click it to open the call in a new tab.
When you compare people, click a name in the legend to highlight its line, or click the **X** next to it to remove it.
To look at two views at once, click **+** next to **Show Calls**. Another chart opens with its own score, people and **Show Calls** controls. Click the trash icon on a chart to remove it.
## 4. Compare reps in the table
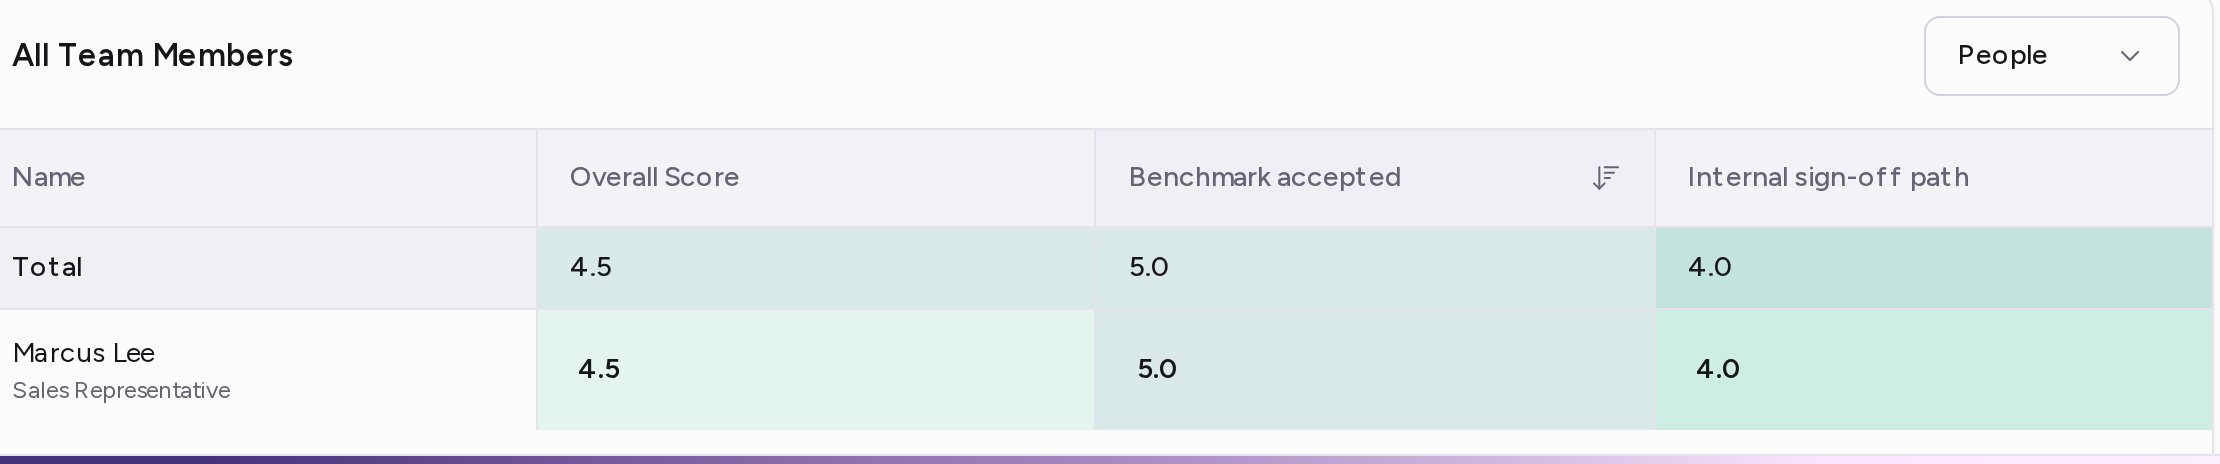
The **All Team Members** table has one row per rep, with their **Overall Score** and a column for each field of the scorecard. Each cell is colored by how high the score is on the scorecard's scale, and the **Total** row at the top averages each column.
* Click a column header to sort by it. Click again to reverse the order.
* Use the **People** dropdown above the table to show only some teams or reps. Click **Reset** to show everyone again. If you manage a team, the table opens with your primary team picked.
## 3. Read the chart
By default, the chart shows **All Teams Average**: the overall score of every scored call in the date range, as a trend line.
To change what the chart shows, use the controls above it:
* **Scorecard Average**: the first dropdown charts the overall score. Pick one of the scorecard's fields instead to chart that criterion alone.
* **People**: pick teams or reps to compare. Each one gets its own line, and each team also has an average option named after it (for example, **Sales Average**). Use **Search...** to find someone, or **Select All**. Click **Reset** to go back to the overall view. If you manage a team, the chart opens with your primary team and its members already picked.
* **Show Calls**: shows each scored call as a dot on the chart. Hover over a dot to see the call's title and score, and click it to open the call in a new tab.
When you compare people, click a name in the legend to highlight its line, or click the **X** next to it to remove it.
To look at two views at once, click **+** next to **Show Calls**. Another chart opens with its own score, people and **Show Calls** controls. Click the trash icon on a chart to remove it.
## 4. Compare reps in the table
The **All Team Members** table has one row per rep, with their **Overall Score** and a column for each field of the scorecard. Each cell is colored by how high the score is on the scorecard's scale, and the **Total** row at the top averages each column.
* Click a column header to sort by it. Click again to reverse the order.
* Use the **People** dropdown above the table to show only some teams or reps. Click **Reset** to show everyone again. If you manage a team, the table opens with your primary team picked.
 ## 5. Drill down into a rep's calls
Click a rep's row to open their panel. It shows:
* the rep's trend chart for the same scorecard and dates, with its own score dropdown and **Show Calls** button;
* the **Conversations** table: each of the rep's scored calls, with the call's date, its **Overall Score** and its score on each field.
Click a call's title to open it in a new tab, on the call page where you can [review its scorecard](/core-features/scorecards-on-a-call).
## Troubleshooting
Your organization has no scorecard template yet. Create one in [Build a Scorecard Template](/workspace-setup/create-scorecards). A template scores the calls processed after you save it.
The dropdown lists the teams the scorecard applies to. To add a team, edit the template's **Teams** in [Build a Scorecard Template](/workspace-setup/create-scorecards).
This documentation is built and hosted on [Mintlify](https://mintlify.com), a developer documentation platform.
## 5. Drill down into a rep's calls
Click a rep's row to open their panel. It shows:
* the rep's trend chart for the same scorecard and dates, with its own score dropdown and **Show Calls** button;
* the **Conversations** table: each of the rep's scored calls, with the call's date, its **Overall Score** and its score on each field.
Click a call's title to open it in a new tab, on the call page where you can [review its scorecard](/core-features/scorecards-on-a-call).
## Troubleshooting
Your organization has no scorecard template yet. Create one in [Build a Scorecard Template](/workspace-setup/create-scorecards). A template scores the calls processed after you save it.
The dropdown lists the teams the scorecard applies to. To add a team, edit the template's **Teams** in [Build a Scorecard Template](/workspace-setup/create-scorecards).
This documentation is built and hosted on [Mintlify](https://mintlify.com), a developer documentation platform.