

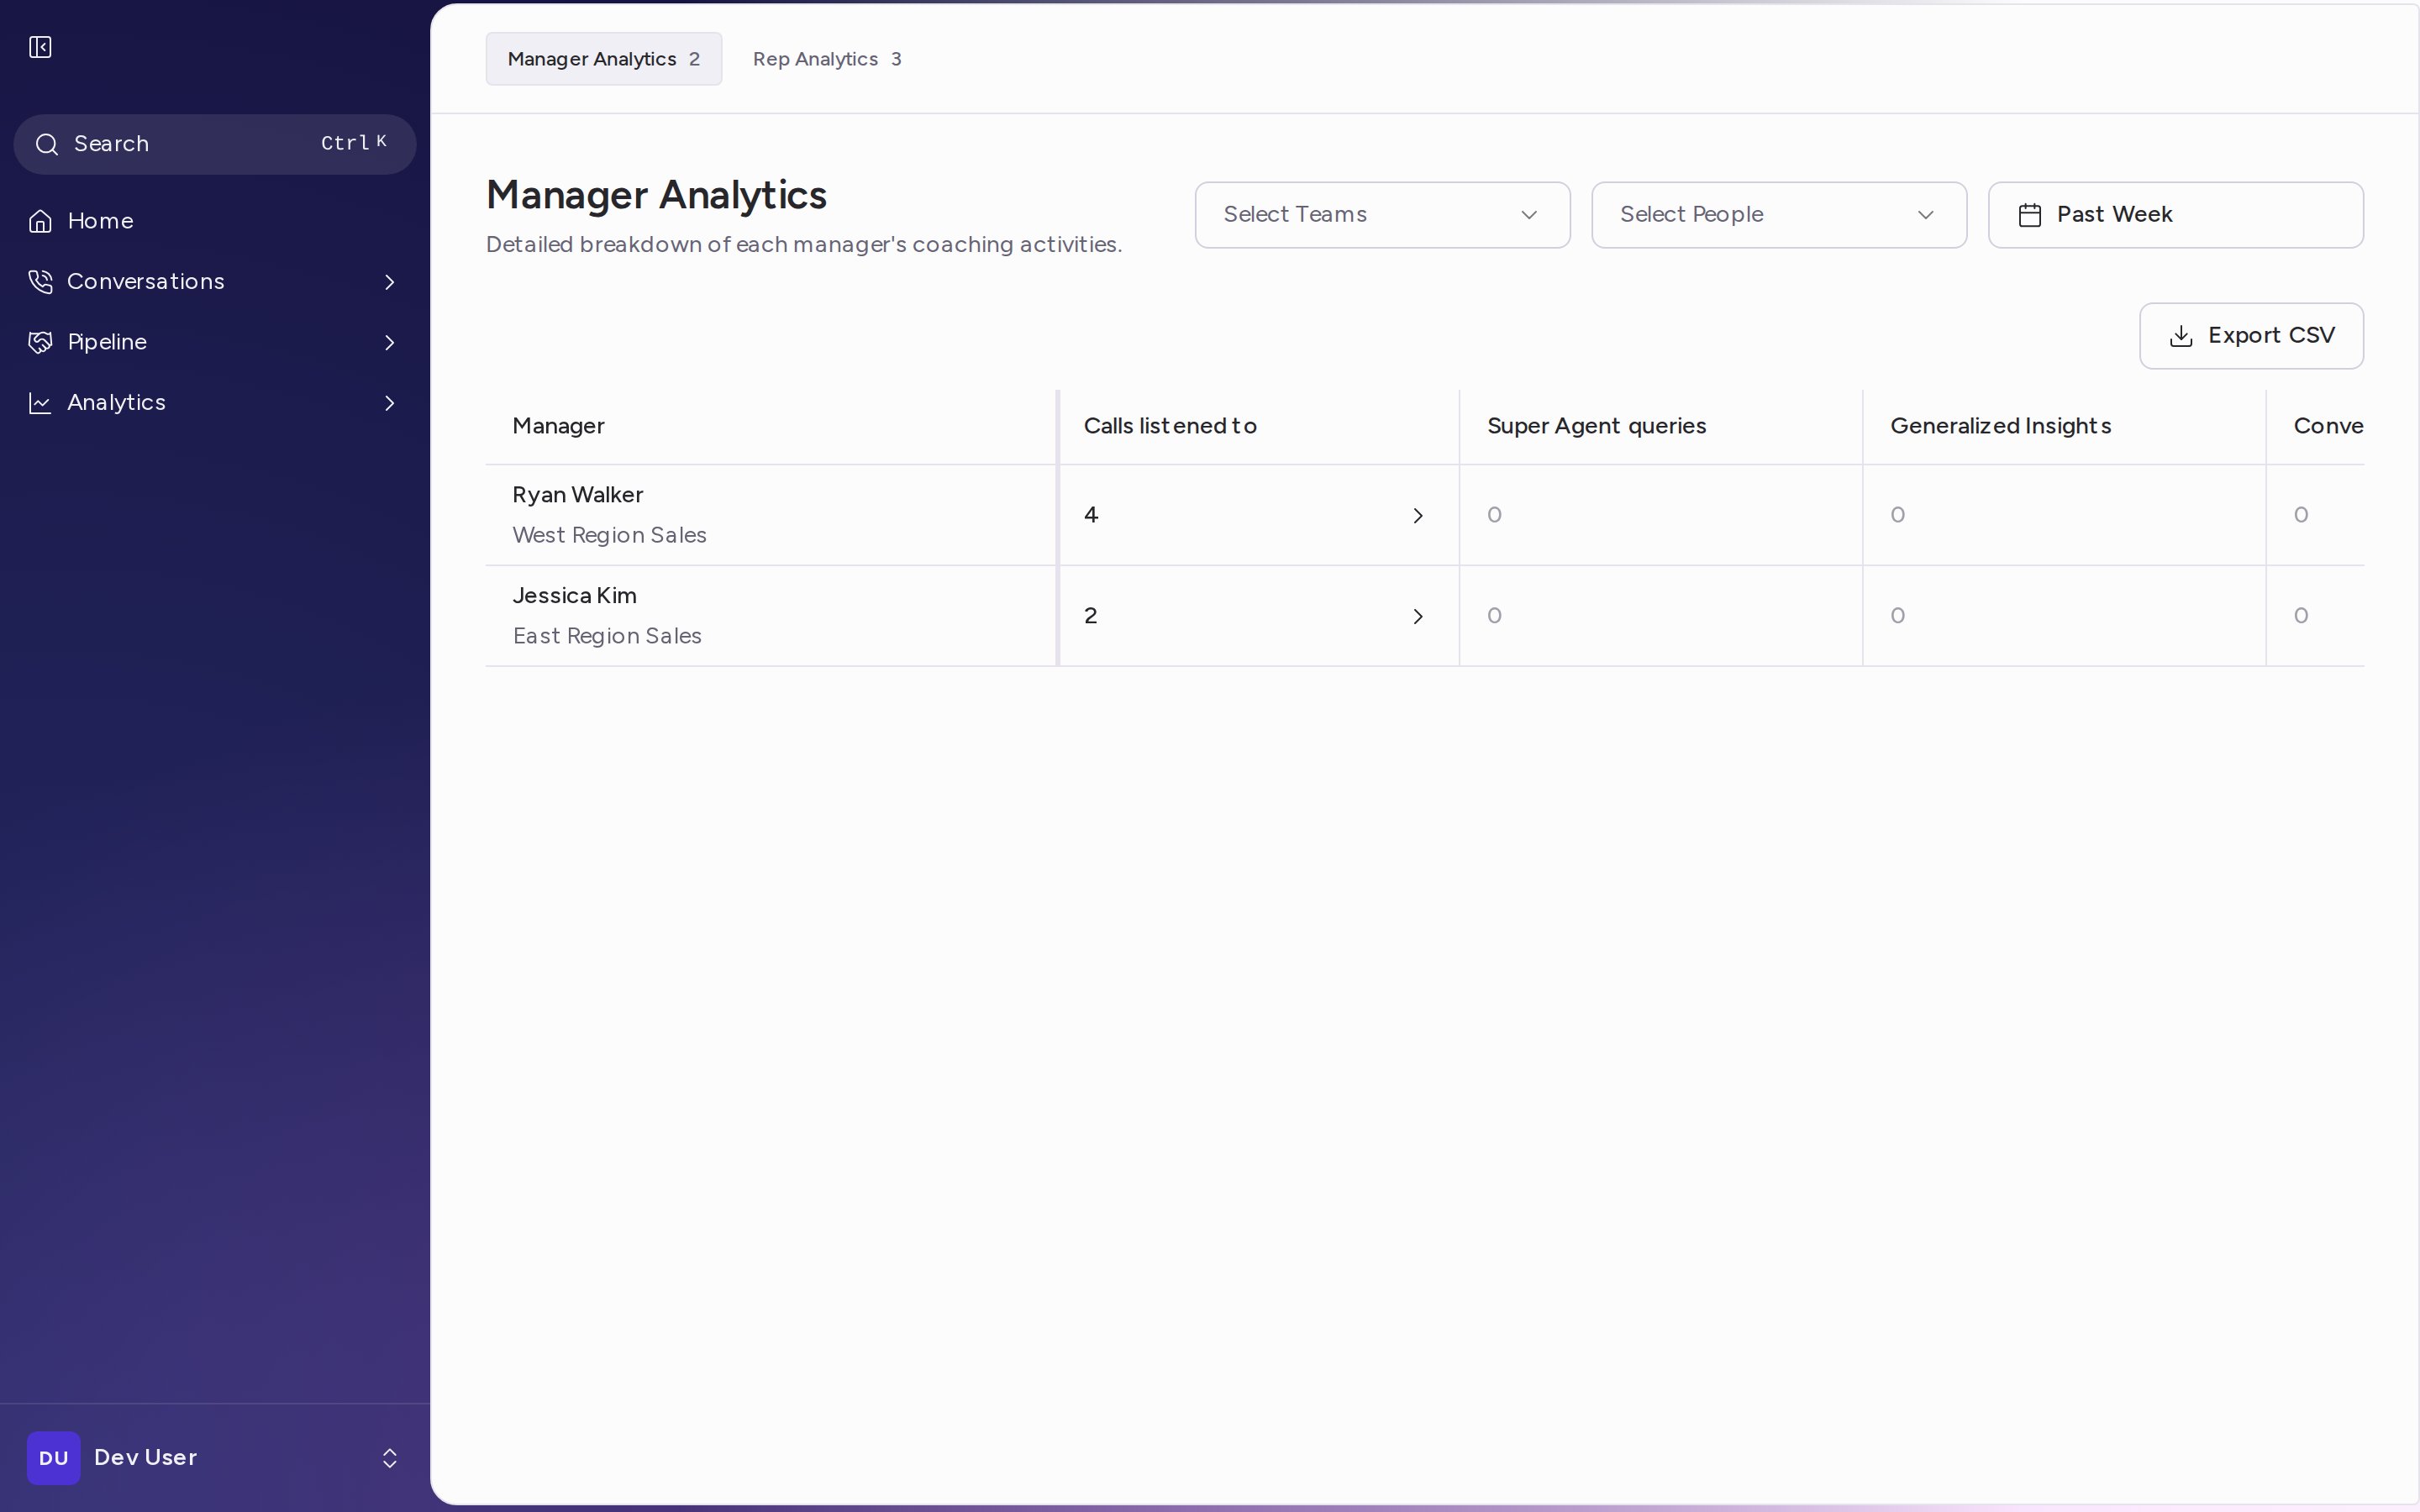
1. Open Manager Analytics
In Attention, go to Analytics → Manager Analytics in the sidebar. The page has two tabs at the top. The number next to each tab is how many people it lists.- Manager Analytics: one row per user with the Manager role.
- Rep Analytics: one row per user with the Sales Rep role.
2. Filter the table
The filters sit at the top right of the page and apply to the tab you are on. Switching tabs resets them.- Select Teams: show only the members of one or more teams.
- Select People: show only the people you pick, searchable by name or email.
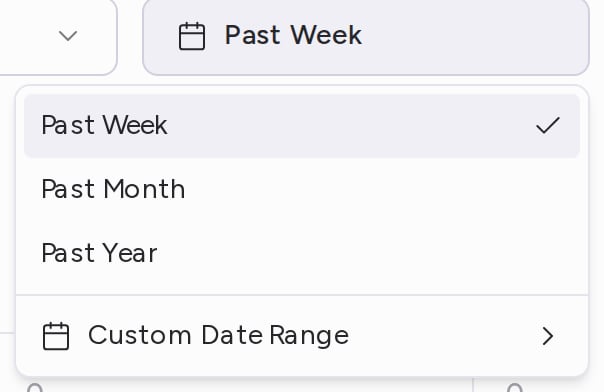
- Date range: Past Week by default. Choose Past Month or Past Year, or click Custom Date Range, pick the first and last day on the calendar, and click Confirm Selection. To go back to the past week, click the × in the date field.
3. Read the metrics
Both tabs share most columns. Counts cover the selected date range unless the table below says otherwise.See the details behind a number
Click a number in Calls listened to, Comments left or Snippets created to open a side panel with the items behind it, newest first, each with its call (or snippet) title and date. For comments, the panel also shows the comment text. Click an item to open its call in a new tab.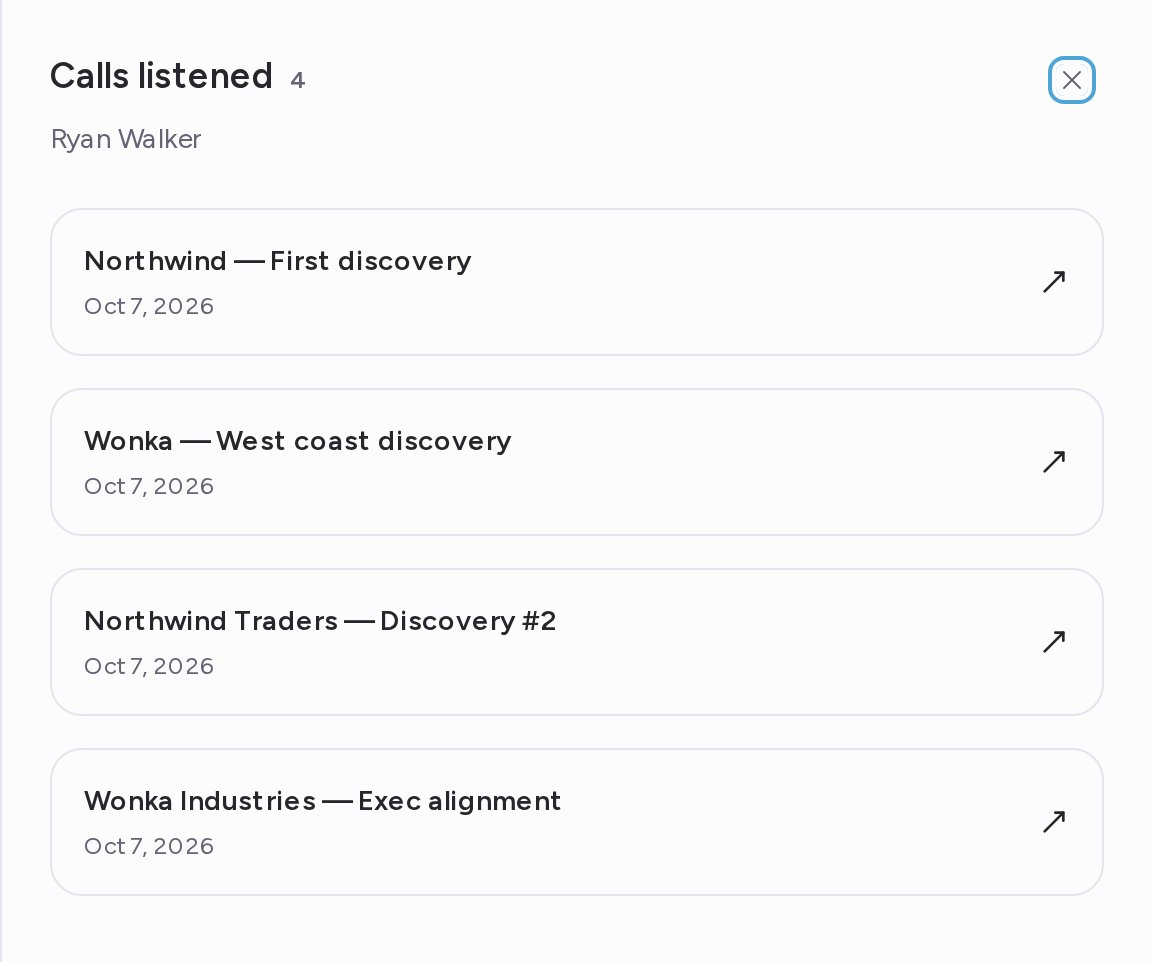
4. Export to CSV
Click Export CSV above the table. Attention downloads the rows you are looking at, with the filters you set, as a CSV file. The file has one row per person with their name, Email and Team, then the same columns as the table. Comments and snippets each get an extra column with their per-call average (Average comments left, Average snippets created), and the linked account columns read Yes or No. The file name tells you what it contains: the tab, the date range and, when you filtered, how many teams or people you picked. For example,rep-analytics_2026-09-30_to_2026-10-07_2-teams.csv.
Need help? Contact support@attention.com.