

1. Open Scoring
In the sidebar, go to Analytics → Scoring. The page opens on Scorecard Summary, with a chart at the top and the All Team Members table below it.2. Pick a scorecard and a date range
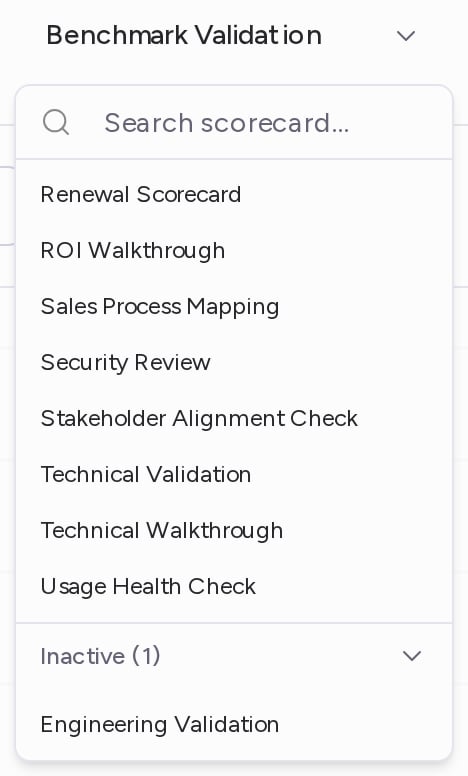
At the top of the page, next to Scorecard Summary:- Click the scorecard picker and choose a scorecard. You can type in Search scorecard… to find it. The page opens on your first active scorecard.
- Click the date range and choose Past Week, Past Month, Past Year or Max. To pick your own dates, click Custom Date Range. The page opens on Past Week.
3. Read the chart
By default, the chart shows All Teams Average: the overall score of every scored call in the date range, as a trend line. To change what the chart shows, use the controls above it:- Scorecard Average: the first dropdown charts the overall score. Pick one of the scorecard’s fields instead to chart that criterion alone.
- People: pick teams or reps to compare. Each one gets its own line, and each team also has an average option named after it (for example, Sales Average). Use Search… to find someone, or Select All. Click Reset to go back to the overall view. If you manage a team, the chart opens with your primary team and its members already picked.
- Show Calls: shows each scored call as a dot on the chart. Hover over a dot to see the call’s title and score, and click it to open the call in a new tab.
4. Compare reps in the table
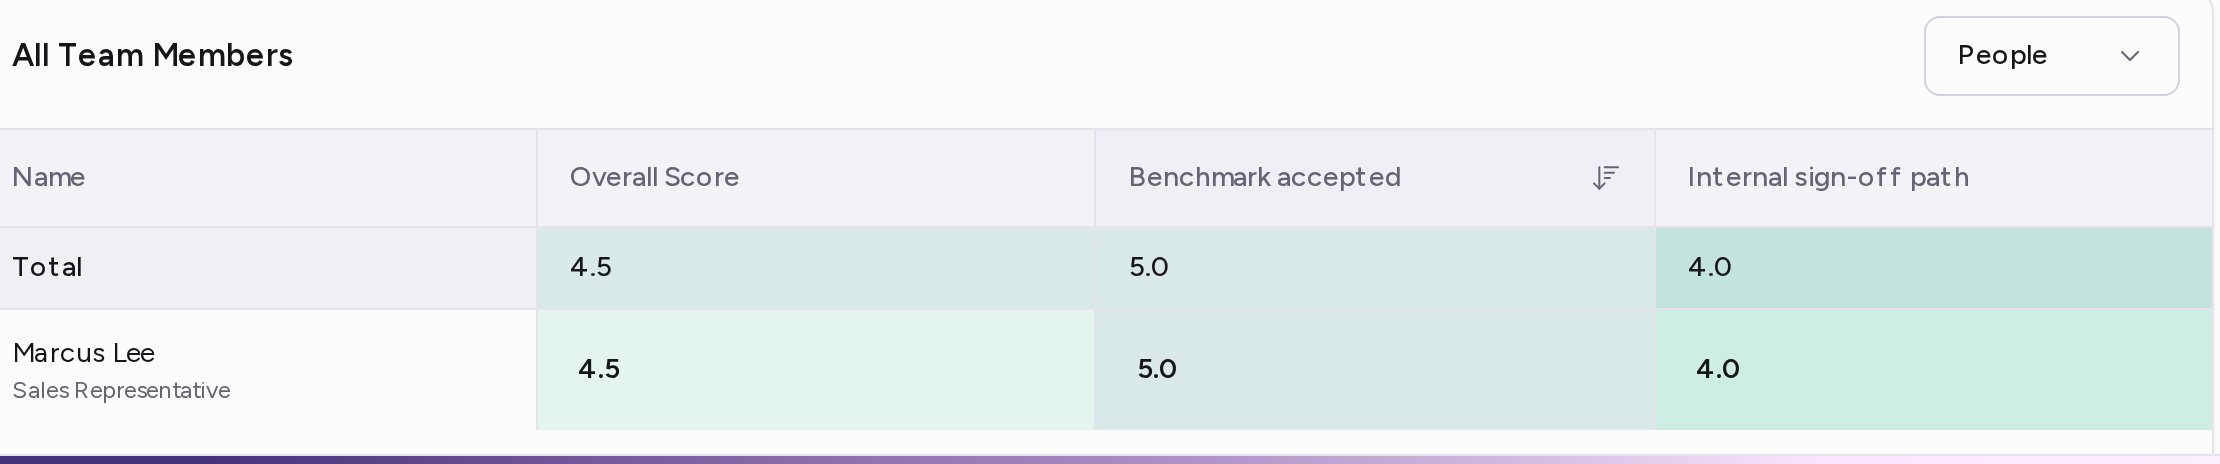
The All Team Members table has one row per rep, with their Overall Score and a column for each field of the scorecard. Each cell is colored by how high the score is on the scorecard’s scale, and the Total row at the top averages each column.- Click a column header to sort by it. Click again to reverse the order.
- Use the People dropdown above the table to show only some teams or reps. Click Reset to show everyone again. If you manage a team, the table opens with your primary team picked.
5. Drill down into a rep’s calls
Click a rep’s row to open their panel. It shows:- the rep’s trend chart for the same scorecard and dates, with its own score dropdown and Show Calls button;
- the Conversations table: each of the rep’s scored calls, with the call’s date, its Overall Score and its score on each field.
Troubleshooting
The page shows No calls scored
The page shows No calls scored
Your organization has no scorecard template yet. Create one in Build a Scorecard Template. A template scores the calls processed after you save it.
A team or rep is missing from the People dropdown
A team or rep is missing from the People dropdown
The dropdown lists the teams the scorecard applies to. To add a team, edit the template’s Teams in Build a Scorecard Template.